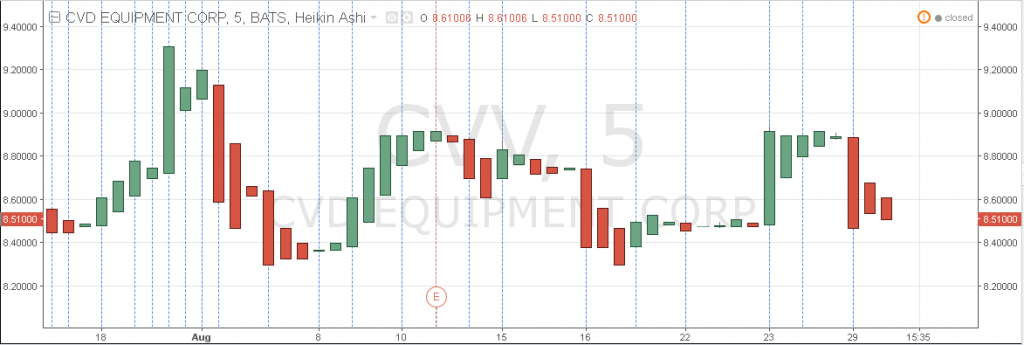
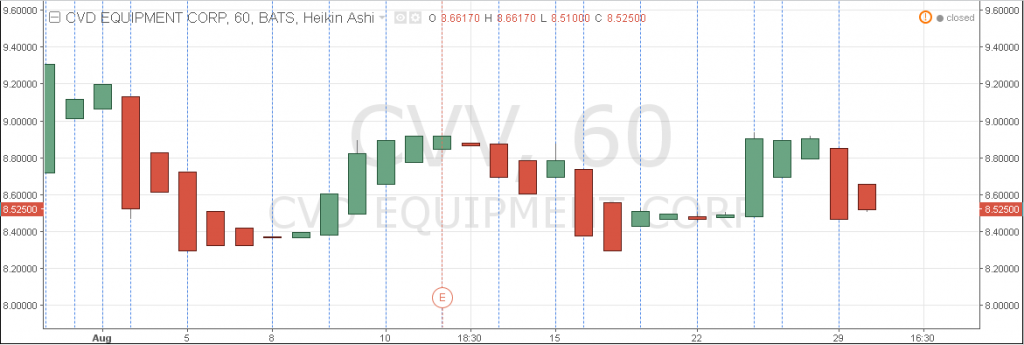
When the symbol with we are working does not have enough liquidity, the platform can display graphics deformed with fewer quantity of candles than usual.
This “loss” of bars/candles is because the plotter display a element only if there were movements during the time corresponding to said bar, depending on the timeframe we’re working.
A lowest timeframe (1 minute, 5 minutes …), has more probability to get this problem.

CVD Equipment Corp (CVV) with Heiken Ashi candles at 5 minutes. The lack of liquidity for this share reports a graphic with 1-5 candles by day (instead of 77 with other more liquid share or merchant)

The same company with Heiken Ashi candles at 1 hour. The lack of liquidity for this share reports a graphic with 1-3 candles by day (instead of 6 with other more liquid share/subyacent)
PineScripts.